MIT 6.828 Operating System Engineering
该实验原始指南
简介
本实验分为三个部分
- getting familiarized with x86 assembly language, the QEMU x86 emulator, and the PC’s power-on bootstrap procedure
- examines the boot loader for our 6.828 kernel
- delves into the initial template for our 6.828 kernel itself
PC Bootstrap
介绍x86汇编语言和PC引导程序(PC Bootstrap),并开始使用QEMU和QEMU/GDB调试
Getting Started with x86 assembly
MIT官方为我们提供了一个关于汇编语言的参考资料pcasm-book,里面基本介绍了汇编语言的方方面面,你可以把这本书作为一个备查,遇到没看过的命令就上里面查,或者直接上网查。如果没有任何汇编基础,建议还是看一看书,把一些基础的指令看懂
本书中的示例是为NASM汇编程序编写的,而我们将使用GNU汇编程序。NASM使用所谓的Intel语法,而GNU使用AT&T语法。虽然在语义上是等效的,但是程序集文件会有很大不同,至少表面上看,这取决于使用的语法。幸运的是,两者之间的转换非常简单,并且在汇编指南中有所介绍
Simulating the x86
Instead of developing the operating system on a real, physical personal computer (PC), we use a program that faithfully emulates a complete PC: the code you write for the emulator will boot on a real PC too. Using an emulator simplifies debugging; you can, for example, set break points inside of the emulated x86, which is difficult to do with the silicon version of an x86.
进行该部分需要安装QEMU(MIT 6.828 Lab:Guide,该文章中有实验的所有前期准备指南)和熟悉GDB调试()
Everything after 'Booting from Hard Disk...' was printed by our skeletal JOS kernel; the K> is the prompt printed by the small monitor, or interactive control program, that we've included in the kernel. These lines printed by the kernel will also appear in the regular shell window from which you ran QEMU. This is because for testing and lab grading purposes we have set up the JOS kernel to write its console output not only to the virtual VGA display (as seen in the QEMU window), but also to the simulated PC's virtual serial port, which QEMU in turn outputs to its own standard output.
启动给内核之后,所有字符就是由JOS kernel产生
There are only two commands you can give to the kernel monitor, help and kerninfo.
现在只有两个命令可以使用:help kerninfo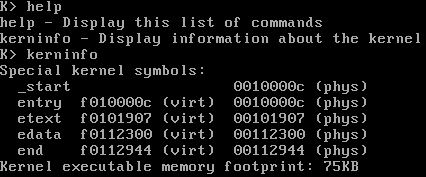
Although simple, it's important to note that this kernel monitor is running "directly" on the "raw (virtual) hardware" of the simulated PC. This means that you should be able to copy the contents of obj/kern/kernel.img onto the first few sectors of a real hard disk, insert that hard disk into a real PC, turn it on, and see exactly the same thing on the PC's real screen as you did above in the QEMU window
虽然该内核还比较简单,但只要愿意,可以将该内核镜像写入硬盘前几个扇区,就能想真正启动PC一样启动它,并能看到完全一样的东西
The PC’s Physical Address Space
A PC's physical address space is hard-wired to have the following general layout: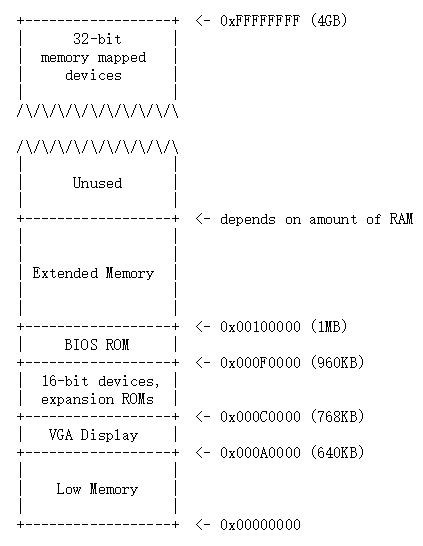
早期基于16位Intel 8088处理器只能操作1MB物理内存,因此物理地址空间起始于0x00000000到0x000FFFFF,其中640KB为Low memory,这只能被随机存储器(RAM)使用
从0x000A0000到0x000FFFFF的384KB留着给特殊使用,例如作为视频显示缓存或者储存在非易失存储器的硬件。从0x000F0000到0x000FFFFF占据64KB区域的部分是最重要的BIOS
现在的x86处理器支持超过4GB的物理RAM,所以RAM扩展到了0xFFFFFFFF。JOS这里只用开始的256MB,所以假设PC只有32位地址空间
The ROM BIOS
这部分研究计算机如何启动
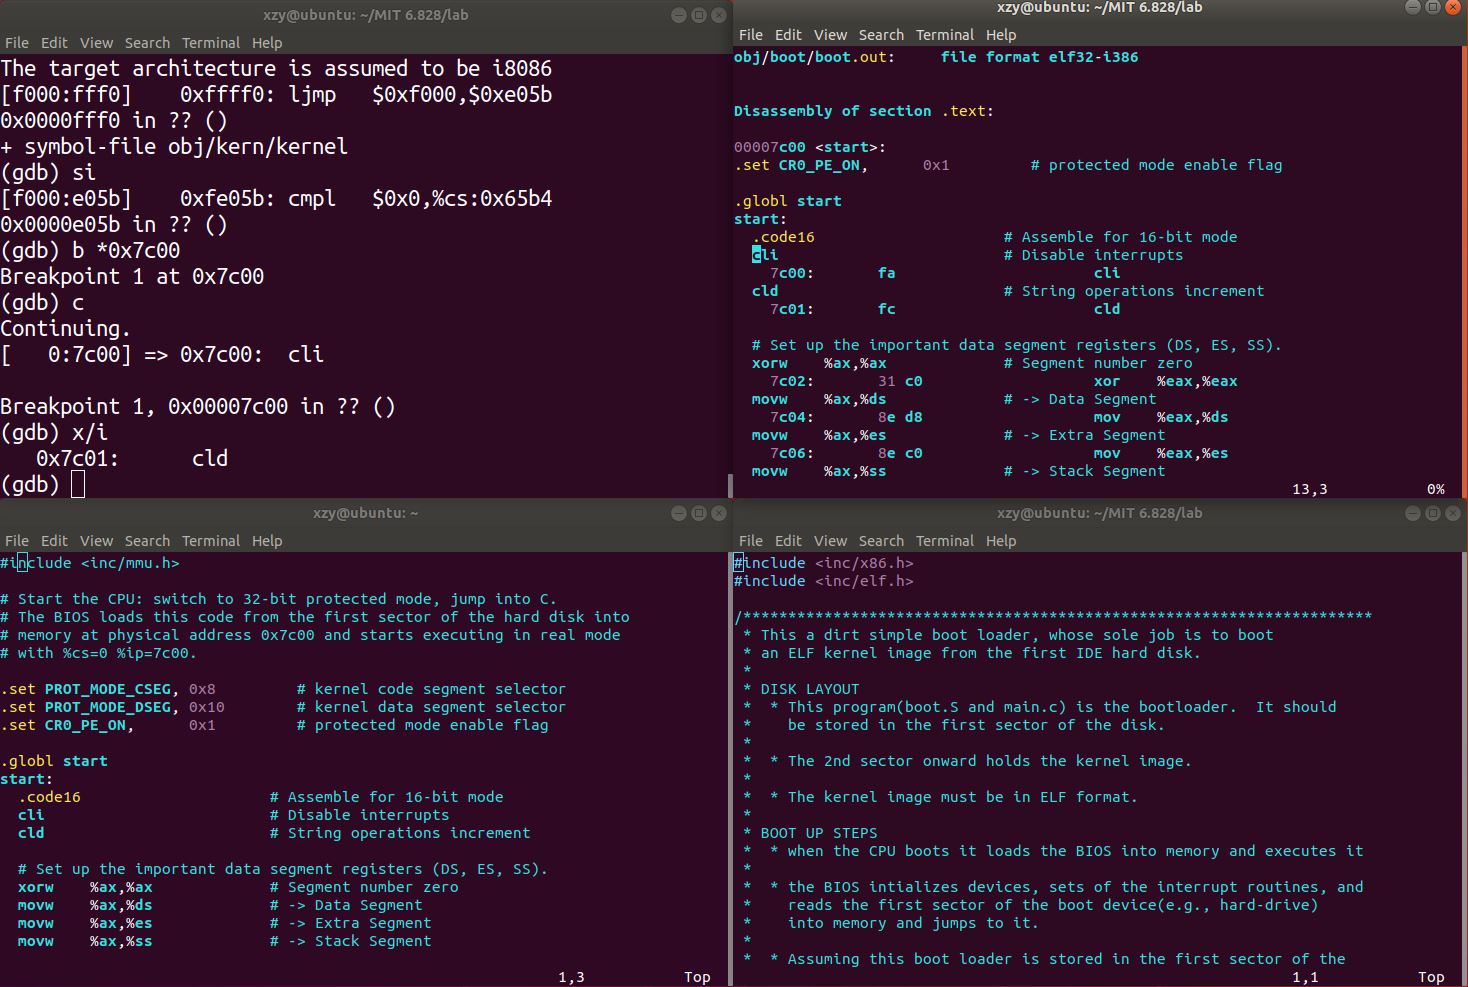
在一个终端中输入make qemu-gdb,这将启动QEMU,但QEMU在处理器执行第一条指令之前停止,并等待来自GDB的调试连接,另一个终端输入make gdb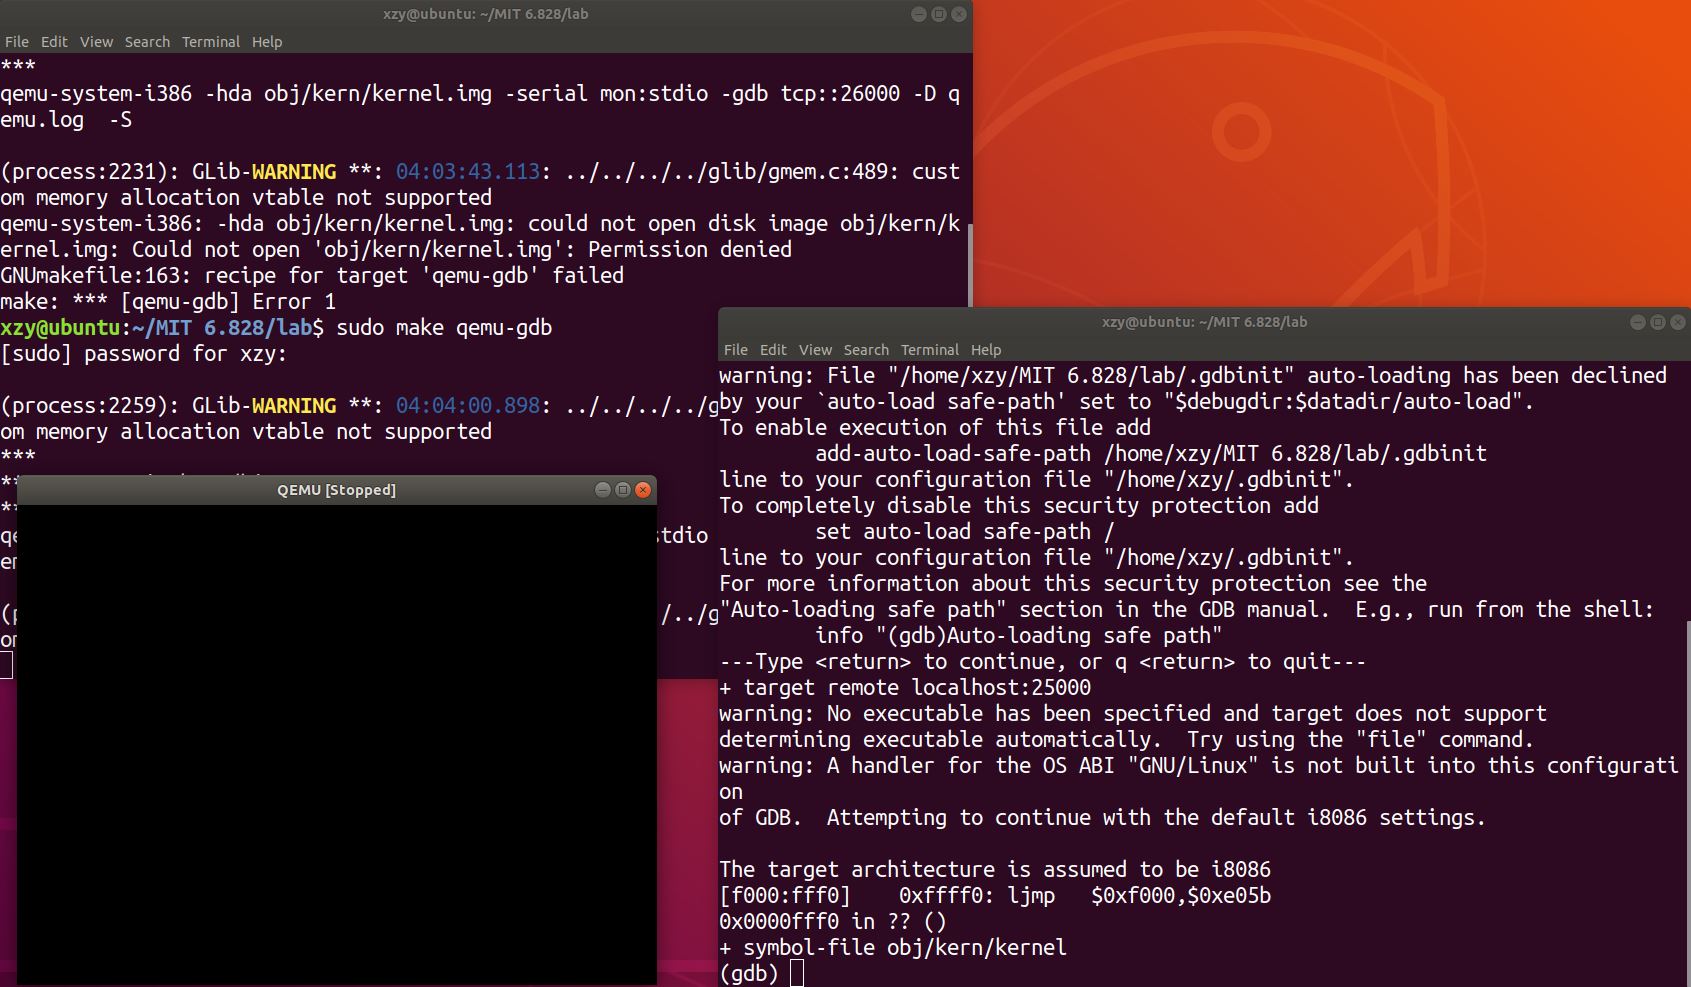
[f000:fff0] 0xffff0: ljmp $0xf000,$0xe05b是GDB反汇编出的第一条执行指令,表明:
- IBM PC从物理地址
0x000ffff0处执行,该地址位于为ROM BIOS保留的64KB区域的最顶端 - PC从地址
CS=0xf000,IP=0xfff0开始执行 - 执行的第一条指令是
jmp指令,它跳转到分段地址CS = 0xf000,IP=0xe05b
由于PC中的BIOS与物理地址范围0x000f0000-0x000fffff“硬连线”,因此该设计可确保BIOS在上电或任何系统重启后始终首先控制机器。QEMU仿真器带有自己的BIOS,它放置在处理器的模拟物理地址空间中的位置。当通电后,处理器进入实模式也就是设置CS:IP两个寄存器为CS=0xf000,IP=0xfff0,为什么这个段地址指示的是0x000ffff0?
0x000ffff0是BIOS结束前的16个字节(0x100000)
当BIOS启动,它设置了一个中断描述符表并初始化多个设备比如VGA显示器。在初始化PCI总线和所有重要的设备之后,它寻找可引导的设备,之后读取Boot loader并转移控制
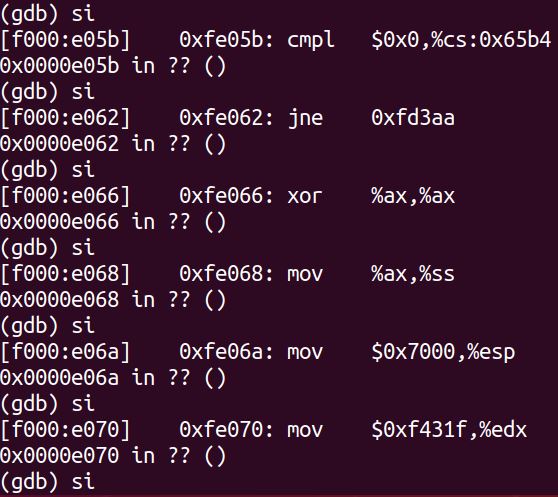 可以通过GDB
si命令一步步猜测BIOS正在做什么!
The Boot Loader
PC的软盘和硬盘分为512个字节区域,称为扇区。扇区是磁盘的最小传输粒度:每个读取或写入操作必须是一个或多个扇区,并在扇区边界上对齐。如果磁盘是可引导的,则第一个扇区称为引导扇区,因为这是boot loader代码所在的位置。当BIOS找到可引导的软盘或硬盘时,它将512字节的引导扇区加载到物理地址0x7c00到0x7dff的内存中,然后使用jmp指令将CS:IP设置为0000:7c00,将控制权传递给boot loader
对于6.828,boot loader包含一个汇编语言源文件boot/boot.S和一个C源文件boot/main.c,仔细查看这些源文件,确保您了解正在发生的事情
boot loader分为汇编语言和C语言两部分的原因,我想是因为最开始启动的时候使用汇编更加精准,之后使用C则使编码效率更高,语义更丰富
在main.c有以下注释,详细讲述了启动流程1
2
3
4
5
6
7
8
9
10
11
12
13
14
15
16
17
18
19
20
21
22
23
24
25
26
27/**********************************************************************
* This a dirt simple boot loader, whose sole job is to boot
* an ELF kernel image from the first IDE hard disk.
*
* DISK LAYOUT
* * This program(boot.S and main.c) is the bootloader. It should
* be stored in the first sector of the disk.
*
* * The 2nd sector onward holds the kernel image.
*
* * The kernel image must be in ELF format.
*
* BOOT UP STEPS
* * when the CPU boots it loads the BIOS into memory and executes it
*
* * the BIOS intializes devices, sets of the interrupt routines, and
* reads the first sector of the boot device(e.g., hard-drive)
* into memory and jumps to it.
*
* * Assuming this boot loader is stored in the first sector of the
* hard-drive, this code takes over...
*
* * control starts in boot.S -- which sets up protected mode,
* and a stack so C code then run, then calls bootmain()
*
* * bootmain() in this file takes over, reads in the kernel and jumps to it.
**********************************************************************/
boot loader执行两个主要功能:
- boot loader将处理器从实模式切换到32位保护模式,因为只有在此模式下,软件才能访问处理器物理地址空间中1MB以上的所有内存
- boot loader通过x86的特殊I/O指令直接访问IDE磁盘设备寄存器,从硬盘读取内核
在了解了boot loader源代码之后,查看文件obj/boot/boot.asm。此文件是我们的GNUmakefile在编译boot loader后创建的boot loader的反汇编。这个反汇编文件可以很容易地查看所有boot loader代码所在的物理内存的确切位置,并且可以更轻松地跟踪在GDB中单步执行boot loader时发生的情况。同样,obj/kern/kernel.asm包含一个JOS内核的反汇编,它通常可用于调试
Exercise 3
在地址0x7c00处设置断点,这是加载引导扇区的位置。继续执行直到该断点。通过跟踪开机代码/boot.S、使用的源代码、反汇编文件OBJ的/boot/boot.asm跟踪你在哪里。还可以使用GDB中的x/i命令来反汇编boot loader中的指令序列,并将原始boot loader代码与obj/boot/boot.asm和GDB中的反汇编进行比较
跟踪main.c/bootmain(),然后进入readsect() 。确定与readsect()中每个语句对应的精确汇编指令。跟踪readsect()的其余部分并返回到bootmain(),并识别for循环的开始和结束,从磁盘读取内核的剩余扇区。找出循环结束时将运行的代码,在那里设置断点,并继续该断点。然后逐步执行boot loader的其余部分
问题:
- At what point does the processor start executing 32-bit code? What exactly causes the switch from 16- to 32-bit mode?
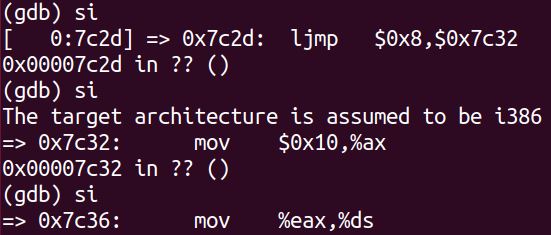
What is the last instruction of the boot loader executed, and what is the first instruction of the kernel it just loaded?
1
2
3
4
5
6
// call the entry point from the ELF header
// note: does not return!
((void (*)(void)) (ELFHDR->e_entry))();
(gdb) si
=> 0x10000c: movw $0x1234,0x472How does the boot loader decide how many sectors it must read in order to fetch the entire kernel from disk? Where does it find this information?
通过查看ELF信息头查看
回答完这三个命令,我们再好好看一看这几段代码!1
2
3
4
5
6
7
8
9
10
11
12
13
14
15
16
17
18
19
20
21
22
23
24
25
26
27
28
29
30void
bootmain(void)
{
struct Proghdr *ph, *eph;
// read 1st page off disk
readseg((uint32_t) ELFHDR, SECTSIZE*8, 0);
// is this a valid ELF?
if (ELFHDR->e_magic != ELF_MAGIC)
goto bad;
// load each program segment (ignores ph flags)
ph = (struct Proghdr *) ((uint8_t *) ELFHDR + ELFHDR->e_phoff);
eph = ph + ELFHDR->e_phnum;
for (; ph < eph; ph++)
// p_pa is the load address of this segment (as well
// as the physical address)
readseg(ph->p_pa, ph->p_memsz, ph->p_offset);
// call the entry point from the ELF header
// note: does not return!
((void (*)(void)) (ELFHDR->e_entry))();
bad:
outw(0x8A00, 0x8A00);
outw(0x8A00, 0x8E00);
while (1)
/* do nothing */;
}
bootmain先读取ELF文件头信息(关于ELF文件,可以查看《目标文件》),获取文件大小,然后判断魔数,然后调用readseg函数循环读取扇区内容
1 | // Read 'count' bytes at 'offset' from kernel into physical address 'pa'. |
这个函数有3个参数,第一个是物理地址,第二个是页的大小,第三个是偏移量。函数先计算末尾地址,在根据字节数得出扇区号,最后循环读取扇区内容到内存地址pa处,读完之后,移动内存地址和扇区
Loading the Kernel
现在,我们将对boot/main.c中的boot loader的C语言部分详细介绍
ELF头的C定义在inc / elf.h中。我们感兴趣的计划部分是:
.text:程序的可执行指令.rodata:只读数据,例如C编译器生成的ASCII字符串常量(但是,我们不会费心设置硬件来禁止写入。).data:数据部分保存程序的初始化数据,例如使用初始化器(如int x = 5)声明的全局变量
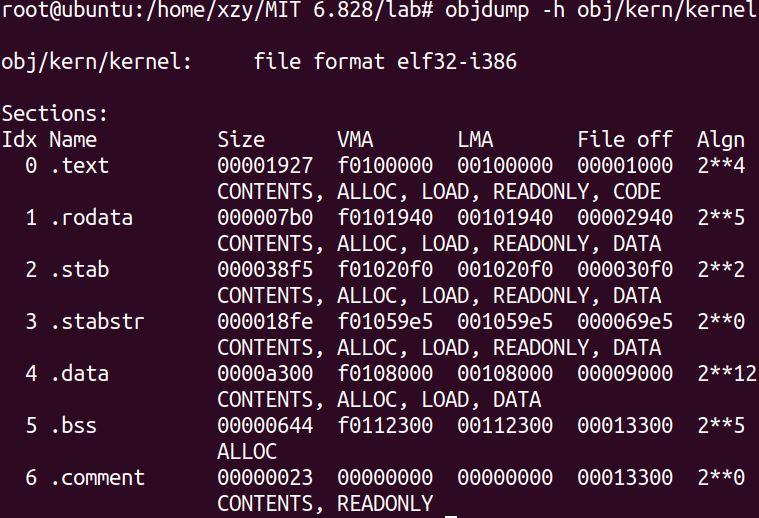
通过objdump -h obj/kern/kernel,检查内核可执行文件中所有段的名称,大小和链接地址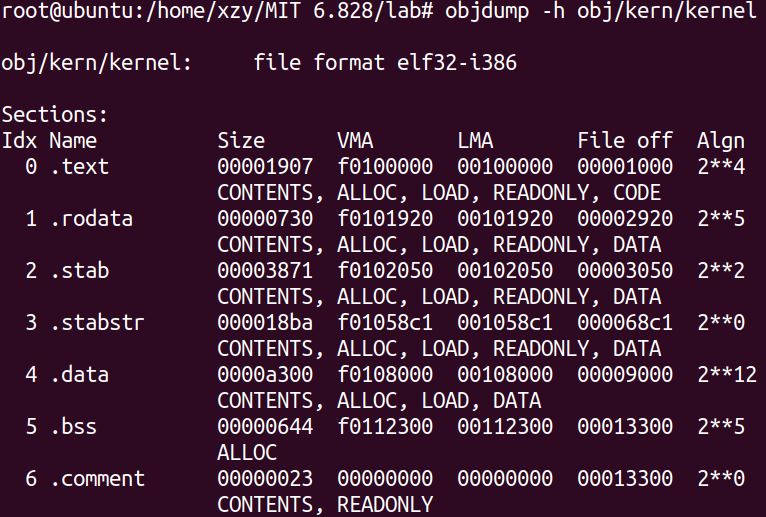
请特别注意.text部分的VMA(或链接地址)和LMA(或加载地址) 。段的加载地址是应该将该段加载到内存中的内存地址。段的链接地址是段期望执行的内存地址
通常链接和加载地址是相同的。查看boot loader的.text部分:objdump -h obj/boot/boot.out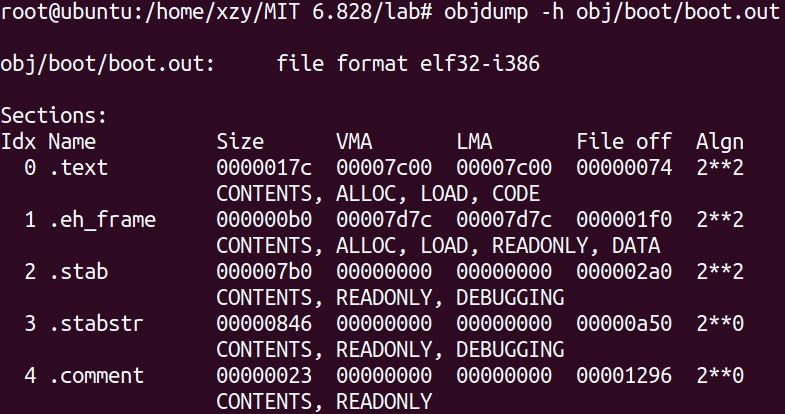
boot loader使用ELF 程序头来决定如何加载节。程序头指定要加载到内存中的ELF对象的哪些部分以及每个应占用的目标地址。您可以通过键入以下内容来检查程序标题objdump -x obj/kern/kernel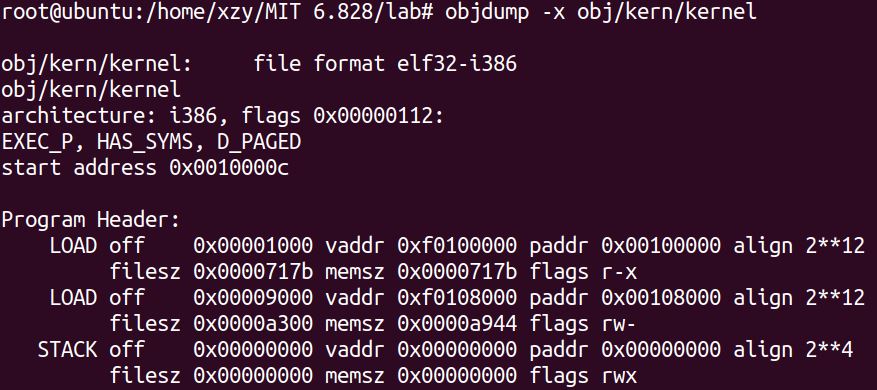
程序头在objdump的输出中的Program Headers下列出。需要加载到内存中的ELF对象的区域是标记为LOAD的区域。给出了每个程序头的其他信息,例如虚拟地址vaddr,物理地址paddr和加载区域的大小memsz filesz
回到boot/main.c,ph->p_pa是每个程序头包含的段目的物理地址
BIOS把引导扇区加载到内存地址0x7c00,这也就是引导扇区的加载地址和链接地址。在boot/Makefrag中,是通过传-Ttext 0x7C00这个参数给链接程序设置了链接地址,因此链接程序在生成的代码中产生正确的内存地址
ELF头中还有一个对我们很重要的字段,名为e_entry,该字段保存程序中入口点的链接地址,也就是程序执行的text字段中的内存地址。objdump -f obj/kern/kernel
现在应该能够理解boot/ main.c中的最小ELF加载器 。它将内核的每个部分从磁盘读入内存的部分加载地址,然后跳转到内核的入口点
Exercise 4
阅读Brian Kernighan和Dennis Ritchie编写的《C程序设计语言》(称为“K&R”)中的5.5和5.1,并理解pointers.c
Exercise 5
change the link address in boot/Makefrag to something wrong, run make clean, recompile the lab with make, and trace into the boot loader again to see what happens.
修改boot/Makefrag,把引导扇区的加载地址和链接地址从0x7c00改为0x8c00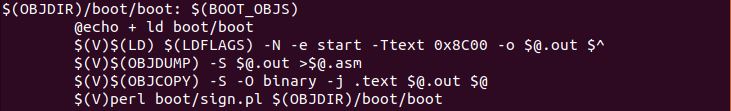
可以发现起始地址从原来的00007c00变为00008c00
由于BIOS载入内核后,是跳转到00007c00,显然这样子就无法加载成功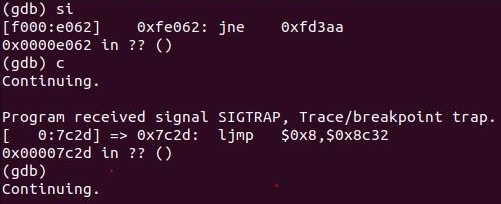
Exercise 6
Examine the 8 words of memory at 0x00100000 at the point the BIOS enters the boot loader, and then again at the point the boot loader enters the kernel. Why are they different? What is there at the second breakpoint? (You do not really need to use QEMU to answer this question. Just think.)
使用GDB的x/Nx ADDR可以打印内存地址ADDR的N个字
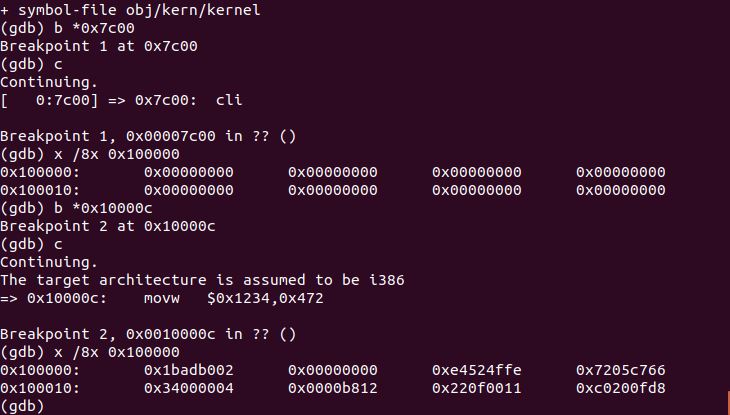
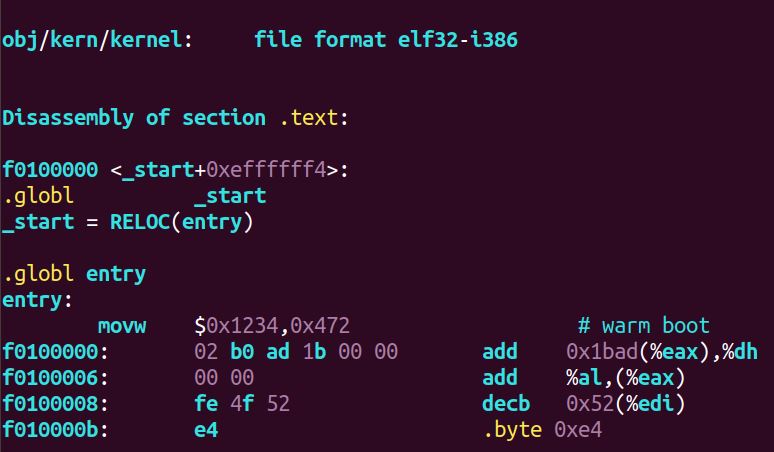
这里很明显是因为内核程序被加载到了0x100000地址处,使用x /8i *0x100000可以反汇编查看内存地址对应的指令,如果去查看kernel的目标文件,会发现两者一致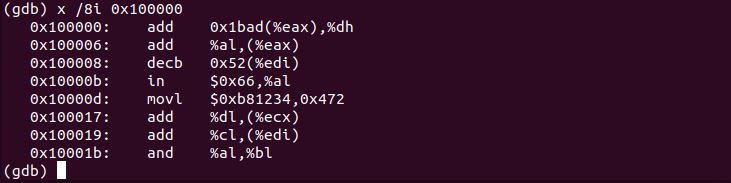
The Kernel
我们现在将开始更详细地研究JOS内核(最后你会写一些代码!)。与boot loader一样,内核以一些汇编语言代码开始,这些代码设置正确,以便C语言代码可以正确执行
Using virtual memory to work around position dependence
boot loader的链接地址和加载地址是一样的,然而kernel 的链接地址和加载地址有些差异。查看kern/kernel.ld可以发现链接地址在0xF0100000,加载地址为0x100000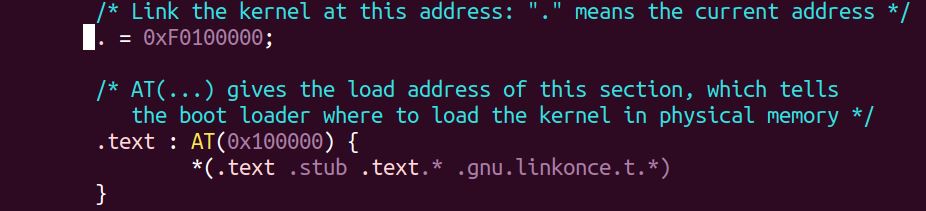
操作系统内核通常喜欢链接并在非常高的虚拟地址(例如0xf0100000)下运行,以便留下处理器虚拟地址空间的下半部分供用户程序使用
许多机器在地址0xf0100000处没有任何物理内存,因此我们无法指望能够在那里存储内核。相反,我们将使用处理器的内存管理硬件将虚拟地址0xf0100000(内核代码期望运行的链接地址)映射到物理地址0x00100000(boot loader将内核加载到物理内存中)。这样,虽然内核的虚拟地址足够高,可以为用户进程留出足够的地址空间,但它将被加载到PC RAM的1MB点的物理内存中,就在BIOS ROM上方。这种方法要求PC至少有几兆字节的物理内存(因此物理地址0x00100000可以工作)
在下一个实验中,我们将把物理地址0x00000000到0x0fffffff的整个底部256MB的物理地址空间分别映射到虚拟地址0xf0000000到0xffffffff。您现在应该明白为什么JOS只能使用前256MB的物理内存
我们使用kern/entrypgdir.c中手写的、静态初始化的页面目录和页表来完成 映射前4MB的物理内存的操作
如果kern/entry.S中没有设置CR0_PG标志,内存引用被视为物理地址(严格来说,它们是线性地址,但boot/boot.S设置从线性地址到物理地址的身份映射,我们永远不会要改变那个);如果设置,内存引用就变为虚拟地址,由虚拟内存硬件转换为物理地址的虚拟地址。 entry_pgdir将0xf0000000到0xf0400000范围内的虚拟地址转换为物理地址0x00000000到0x00400000,以及虚拟地址0x00000000到0x00400000到物理地址0x00000000到0x00400000。任何不属于这两个范围之一的虚拟地址都会导致硬件异常,因为我们尚未设置中断处理,将导致QEMU转储机器状态并退出
Exercise 7
Use QEMU and GDB to trace into the JOS kernel and stop at the movl %eax, %cr0. Examine memory at 0x00100000 and at 0xf0100000. Now, single step over that instruction using the stepi GDB command. Again, examine memory at 0x00100000 and at 0xf0100000. Make sure you understand what just happened.
What is the first instruction after the new mapping is established that would fail to work properly if the mapping weren't in place? Comment out the movl %eax, %cr0 in kern/entry.S, trace into it, and see if you were right.
第一部分没能成功,不知道为什么,不管是在movl %eax, %cr0之前还是之后,两个地址的值都是一样的,照理说应该是不一样的。原因就是之前还没有建立分页机制,高地址内核区域还没有映射到内核的物理地址,而只有低地址有效的.开启分页之后,由于有静态映射表的存在(kern/enterpgdir.c),两块虚拟地址都指向同一块物理地址区域。但是第二阶段却可以完成
在注释掉movl %eax, %cr0,也就是关闭虚拟内存之后,就会出现以下错误,因为物理内存只有0x001002c,无法获取0xf01002c
Formatted Printing to the Console
大多数人认为像printf()这样的函数是理所当然的,有时甚至认为它们是C语言的“原语”。但在OS内核中,我们必须自己实现所有I/O
通读kern/printf.c lib/printfmt.c kern/console.c,确保了解它们之间的关系。在后面的实验中将清楚为什么printfmt.c位于单独的lib目录中
kern/printf.c 和 lib/printfmt.c 依赖 kern/console.c
现在回答一下问题
- Explain the interface between printf.c and console.c. Specifically, what function does console.c export? How is this function used by printf.c?
1 | static void |
上图显示了printf.c实现的接口,下图显示了console.c提供的接口1
2
3
4
5
6
7
8
9
10
11
12
13
14
15
16
17
18
19
20
21
22
23
24// `High'-level console I/O. Used by readline and cprintf.
void
cputchar(int c)
{
cons_putc(c);
}
int
getchar(void)
{
int c;
while ((c = cons_getc()) == 0)
/* do nothing */;
return c;
}
int
iscons(int fdnum)
{
// used by readline
return 1;
}
从中可以看出关键函数是cons_putc(),其功能就是输出字符到控制台,而该函数又是由三个函数组成1
2
3
4
5
6
7
8// output a character to the console
static void
cons_putc(int c)
{
serial_putc(c);
lpt_putc(c);
cga_putc(c);
}
我们一个个来看,先看serial_putc(c),由名字看是串行输出的意思
1 |
|
它控制的是端口0x3F8,inb读取的是COM1 + COM_LSR = 0x3FD端口,outb输出到COM1 + COM_TX = 0x3F8
!(inb(COM1 + COM_LSR) & COM_LSR_TXRDY)则是判断传输缓存是否avail,outb是将字符c输出到传输缓存COM1 + COM_TX
再来看 lpt_putc(),是并行输出的意思,把字符c传输给并口设备端口1
2
3
4
5
6
7
8
9
10
11
12
13
14
15/***** Parallel port output code *****/
// For information on PC parallel port programming, see the class References
// page.
static void
lpt_putc(int c)
{
int i;
for (i = 0; !(inb(0x378+1) & 0x80) && i < 12800; i++)
delay();
outb(0x378+0, c);
outb(0x378+2, 0x08|0x04|0x01);
outb(0x378+2, 0x08);
}
最后是cga_putc(c)1
2
3
4
5
6
7
8
9
10
11
12
13
14
15
16
17
18
19
20
21
22
23
24
25
26
27
28
29
30
31
32
33
34
35
36
37
38
39
40
41
42
43
44
45
46
47
48static void
cga_putc(int c)
{
// if no attribute given, then use black on white
if (!(c & ~0xFF))
        c |= 0x0700;
switch (c & 0xff) {
case '\b':
if (crt_pos > 0) {
crt_pos--;
crt_buf[crt_pos] = (c & ~0xff) | ' ';
}
break;
case '\n':
crt_pos += CRT_COLS;
/* fallthru */
case '\r':
crt_pos -= (crt_pos % CRT_COLS);
break;
case '\t':
cons_putc(' ');
cons_putc(' ');
cons_putc(' ');
cons_putc(' ');
cons_putc(' ');
break;
default:
crt_buf[crt_pos++] = c; /* write the character */
break;
}
// What is the purpose of this?
if (crt_pos >= CRT_SIZE) {
int i;
memmove(crt_buf, crt_buf + CRT_COLS, (CRT_SIZE - CRT_COLS) * sizeof(uint16_t));
for (i = CRT_SIZE - CRT_COLS; i < CRT_SIZE; i++)
crt_buf[i] = 0x0700 | ' ';
crt_pos -= CRT_COLS;
}
/* move that little blinky thing */
outb(addr_6845, 14);
outb(addr_6845 + 1, crt_pos >> 8);
outb(addr_6845, 15);
outb(addr_6845 + 1, crt_pos);
}
首先 !(c & ~0xFF) 是否在 0 ~ 255 之前。\b就是退格键,让缓冲区 crt_buf 的下标 crt_pos 减1。其他的同理,case都是格式操作。default就是往缓冲区里写入字符c。之后就是当缓存超过CRT_SIZE,就是用memmove复制内存内容,证明屏幕放不下了,需要页面向上滚动一行。最后四句代码是将缓冲区的内容输出到显示屏
- Explain the following from console.c
1 | if (crt_pos >= CRT_SIZE) { |
主要是检测当前屏幕的输出buffer是否满了,这里注意memmove是把第二个参数crt_buf + CRT_COLS指向的地址加上(CRT_SIZE - CRT_COLS) * sizeof(uint16_t))后的地址赋值给第一个参数crt_buf
如果buffer满了,把屏幕第一行覆盖掉逐行上移,空出最后一行,并由for循环填充以,最后把crt_pos置于最后一行的行首
- For the following questions you might wish to consult the notes for Lecture 2. These notes cover GCC’s calling convention on the x86.Trace the execution of the following code step-by-step.In the call to cprintf(), to what does fmt point? To what does ap point?
1 | int x = 1, y = 3, z = 4; |
fmt指向的就是字符串"x %d, y %x, z %d\n",ap指向一个参数列表,在这里就是x,y,z
List (in order of execution) each call to cons_putc, va_arg, and vcprintf. For cons_putc, list its argument as well. For va_arg, list what ap points to before and after the call. For vcprintf list the values of its two arguments.
这里的问题就是c语言中的变长参数的实现,先跳过!!!!
- Run the following code.What is the output? Explain how this output is arrived at in the step-by-step manner of the previous exercise. Here’s an ASCII table that maps bytes to characters.The output depends on that fact that the x86 is little-endian. If the x86 were instead big-endian what would you set i to in order to yield the same output? Would you need to change 57616 to a different value?
将下述代码加入kern/monitor.c,并重新编译运行就能看到结果1
2unsigned int i = 0x00646c72;
cprintf("H%x Wo%s\n", 57616, &i);
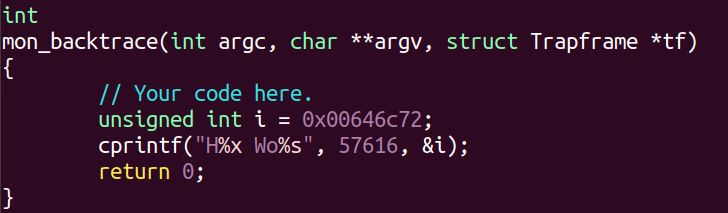 我们看到输出了
He110 World,原理就是根据ASCII码输出。首先%x是指十六进制,所以将 57616转为十六进制就是e110。这里的%s部分是打印的i地址处的值,由于是little-endian机器,所以i的值在储存的时候是72 6c 64 00.这样对应的ASCII码就是rld。如果是大端机器,不需要改变57616,但是i要变为0x726c6400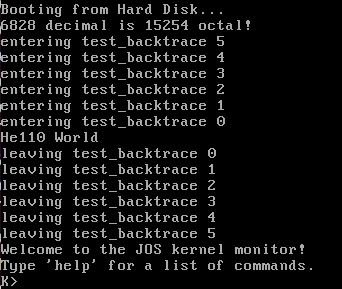
- In the following code, what is going to be printed after ‘y=’? (note: the answer is not a specific value.) Why does this happen?
1
cprintf("x=%d y=%d",3);
看到输出为y因为没有被指定值,所以输出的是不确定的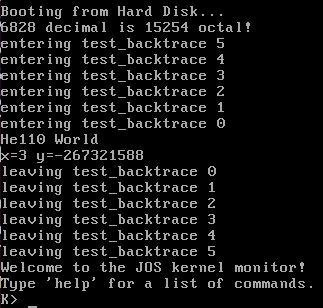
- Let’s say that GCC changed its calling convention so that it pushed arguments on the stack in declaration order, so that the last argument is pushed last. How would you have to change cprintf or its interface so that it would still be possible to pass it a variable number of arguments?
这道题目需要明白怎么实现变长数组才能回答!
1 | int |
...表示参数的数量和类型可能会改变,这个符号只会出现在参数列表的末尾
实现这个的困难在于函数不知道参数的名字,在标准头库<stdarg.h>包含了一系列定义如何遍历参数列表的宏定义
1 |
|
va_list轮流指向每个未命名的变量,这个变量暂时就叫ap(argument pointer),宏va_start初始化使得ap指向第一个未命名参数,va_arg(ap, type)返回一个参数并使ap指向下一个,type表明返回类型和移动距离,最后va_end清理内存
变长函数的实现得益于C默认的cdecl调用惯例的自右向左压栈的参数传递方式,因为栈是以从高往低的方向增长的,va_arg每次是以地址往后增长取出下一参数变量的地址
回到这个问题本身,如果GCC按照声明的顺序压入参数,即自左向右, 那么需要修改上面代码中的 va_start 和 va_arg 两个宏,将其改成用减法得到新地址即可
Exercise 8
We have omitted a small fragment of code - the code necessary to print octal numbers using patterns of the form "%o". Find and fill in this code fragment.
1 | // (unsigned) octal |
找到lib/printfmt.c并照着之前的画个葫芦就行,修改之后启动界面就能显示十进制数6828对应的八进制数15254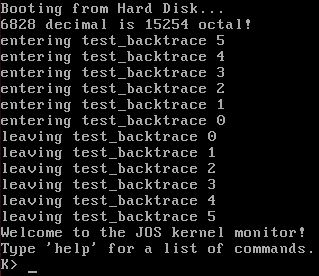
Challenge
Enhance the console to allow text to be printed in different colors. If you're feeling really adventurous, you could try switching the VGA hardware into a graphics mode and making the console draw text onto the graphical frame buffer.
对于将VGA切换成图形模式就略过,不是我们的重点
回到cga_putc(c)函数,这里有这样一段注释// if no attribute given, then use black on white,对应代码是1
2if (!(c & ~0xFF))
c |= 0x0700;
检测c的8bit以上是否为0,如果是,那么黑白显示打印的字符,int c这个变量低8位控制显示的ASCII码。接着8-15bits用来控制颜色输出
因此我们将输出字符修改成1
2
3
4// character
case 'c':
putch(va_arg(ap, int) + 0x1200, putdat);
break;
此时输出的字符X就变成了紫色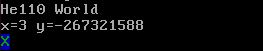
The Stack
我们将更详细地探讨C语言在x86上使用堆栈的方式,并在此过程中编写一个有用的新内核监视器函数,用于打印堆栈的回溯,即查看指令寄存器(IP)的值的变化
x86堆栈指针(esp寄存器)指向当前正在使用的堆栈上的最低位置。低于这个位置的空间还没使用
将值压入堆栈涉及减少堆栈指针,然后将值写入堆栈指针指向的位置。从堆栈中弹出一个值包括读取堆栈指针指向的值,然后增加堆栈指针。在32位模式下,堆栈只能保存32位值,esp总是可以被4整除。各种x86指令(例如调用)被“硬连线”以使用堆栈指针寄存器
Exercise 9
Determine where the kernel initializes its stack, and exactly where in memory its stack is located. How does the kernel reserve space for its stack? And at which "end" of this reserved area is the stack pointer initialized to point to?
在kern/entry.S中找到下面的代码1
2
3
4
5
6
7
8
9
10
11
12
13
14
15
16
17
18
19
20
21
22
23
24
25
26
27relocated:
# Clear the frame pointer register (EBP)
movl $0x0,%ebp # nuke frame pointer
# Set the stack pointer
movl $(bootstacktop),%esp
call i386_init
# Should never get here, but in case we do, just spin.
spin: jmp spin
.data
###################################################################
###################################################################
.p2align PGSHIFT
.globl bootstack
bootstack:
.space KSTKSIZE
.globl bootstacktop
bootstacktop:
bootstacktop就是栈顶,bootstack应该指的就是栈的位置,大小为KSTKSIZE,且恰好在数据段开头位置对齐之后
Exercise 10
To become familiar with the C calling conventions on the x86, find the address of the test_backtrace function in obj/kern/kernel.asm, set a breakpoint there, and examine what happens each time it gets called after the kernel starts. How many 32-bit words does each recursive nesting level of test_backtrace push on the stack, and what are those words?
这个联系其实不难,因为在CSAPP的拆炸弹实验中都是类似的
Exercise 11
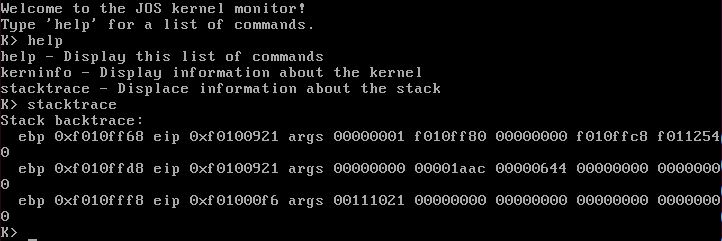
Implement the backtrace function(kern/monitor.c/mon_backtrace()) as specified above1
2
3
4Stack backtrace:
ebp f0109e58 eip f0100a62 args 00000001 f0109e80 f0109e98 f0100ed2 00000031
ebp f0109ed8 eip f01000d6 args 00000000 00000000 f0100058 f0109f28 00000061
...
1 | int |
打印的第一行反映当前正在执行的函数,即mon_backtrace本身,第二行反映调用的函数,mon_backtrace第三行反映调用该函数的函数,依此类推
在每一行中,ebp值表示进入该函数使用的堆栈的基指针:即,在输入函数之后堆栈指针的位置和函数序言代码设置基指针。列出的eip值是函数的返回指令指针:当函数返回时控件将返回的指令地址。返回指令指针通常指向调用指令之后的指令(为什么?)。最后,args之后列出的五个十六进制值 是有问题的函数的前五个参数,它们在调用函数之前就被推到了堆栈上???
可以将此新函数挂钩到内核监视器的命令列表中,以便用户可以交互地调用它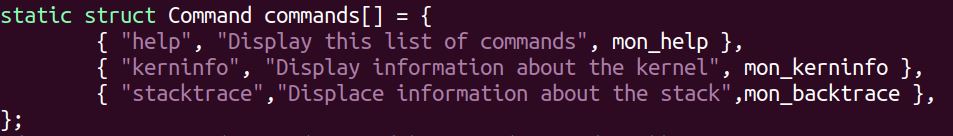
Exercise 12
Modify your stack backtrace function to display, for each eip, the function name, source file name, and line number corresponding to that eip
已经提供debuginfo_eip(),其在符号表中查找EIP,并返回该地址的调试信息,就如注释所示,从特定的指令地址中读取信息填充到Stab结构体中,用于调试。该函数在kern/kdebug.c中定义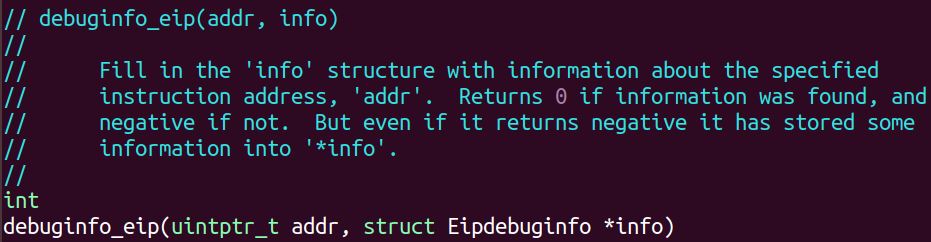
下面的结构则保存着该函数读取的信息1
2
3
4
5
6
7
8
9
10
11// Debug information about a particular instruction pointer
struct Eipdebuginfo {
const char *eip_file; // Source code filename for EIP
int eip_line; // Source code linenumber for EIP
const char *eip_fn_name; // Name of function containing EIP
// - Note: not null terminated!
int eip_fn_namelen; // Length of function name
uintptr_t eip_fn_addr; // Address of start of function
int eip_fn_narg; // Number of function arguments
};
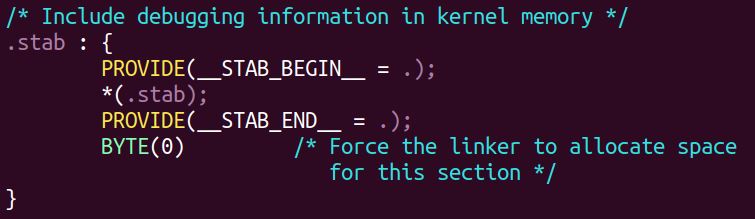
- 在文件kern / kernel.ld中查找
__STAB_ *(即Symbol Table)
objdump -h obj/kern/kernel
objdump -G obj/kern/kernel
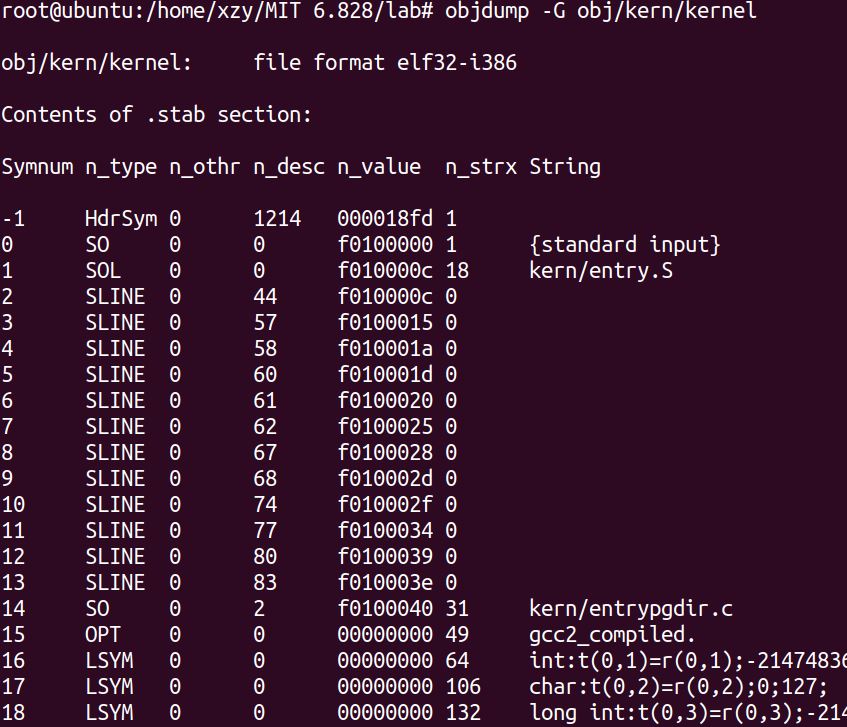
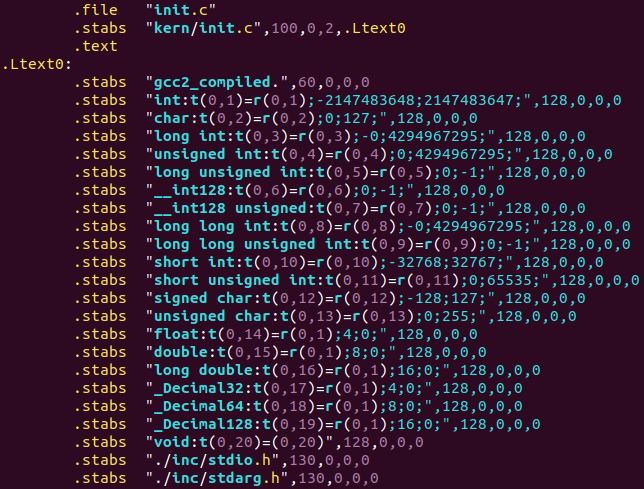
gcc -pipe -nostdinc -O2 -fno-builtin -I. -MD -Wall -Wno-format -DJOS_KERNEL -gstabs -c -S kern/init.c,看init.s.
- 查看boot loader是否在内存中加载符号表作为加载内核二进制文件的一部分
回到这道练习题,要我们在Exercise 11基础之上,显示更多调试信息1
2
3
4
5
6
7
8
9
10
11
12
13
14
15
16
17
18
19
20
21
22
23
24
25
26
27
28
29
30
31
32int
mon_backtrace(int argc, char **argv, struct Trapframe *tf)
{
// Your code here.
int j;
uint32_t ebp = read_ebp();
uint32_t eip = *((uint32_t *)ebp+1);
struct Eipdebuginfo info;
cprintf("Stack backtrace:\n");
while ((int)ebp != 0)
{
cprintf(" ebp 0x%08x eip 0x%08x args ", ebp, eip);
uint32_t *args = (uint32_t *)ebp + 2;
for (j = 0; j < 5; j ++) {
cprintf("%08x ", args[j]);
}
cprintf("\n");
memset(&info,0,sizeof(struct Eipdebuginfo));
if(!debuginfo_eip(eip,&info))
cprintf("\t%s:%d:%s+%u\n",info.eip_file,info.eip_line,info.eip_fn_name,eip-info.eip_fn_addr);
else
cprintf("failed to get debufinfo for eip %x\n",eip);
eip = ((uint32_t *)ebp)[1];
ebp = ((uint32_t *)ebp)[0];
}
return 0;
}
每行给出堆栈帧eip对应文件名和行,后跟函数的名称和eip与函数的第一条指令的偏移量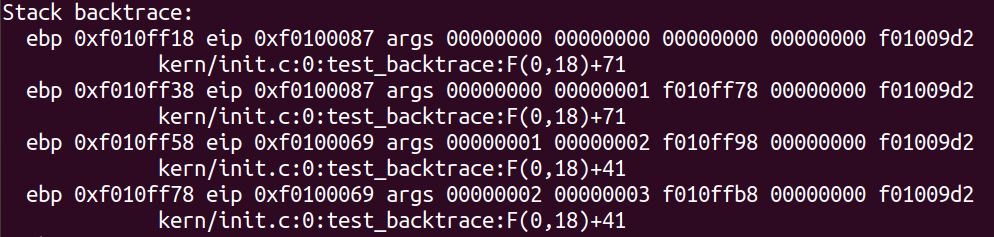
实模式和保护模式区别及寻址方式
我们先来说一下实模式和保护模式的区别。最早期的8086 CPU只有一种工作方式,那就是实模式,而且数据总线为16位,地址总线为20位,实模式下所有寄存器都是16位。而从80286开始就有了保护模式,从80386开始CPU数据总线和地址总线均为32位,而且寄存器都是32位。但80386以及现在的奔腾,酷睿等等CPU为了向前兼容都保留了实模式,现代操作系统在刚加电时首先运行在实模式下,然后再切换到保护模式下运行
相关链接《程序员的自我修养》
实模式寻址方式
刚才说了8086 CPU数据总线为16位,也就是一次最多能取$2^{16}=64KB$数据,这个数据也解释了实模式下为什么每个段最大只有64KB。但刚才还说了其地址总线为20位,这样它能寻址的能力其实是$2^{20}=1MB$,这也就是实模式下CPU的最大寻址能力。段寄存器明明就16位,为什么说它有有$2^{20}=1MB$的寻址能力呢?
因为芯片设计者想出了一种段地址+偏移地址的寻址方式(通常写作段地址:偏移地址)。8086内置4个段寄存器(如下文提到的%ds %es ss),每个段寄存器可以存放一个16位的段地址,在寻址时,处理器首先将段地址左移4位,然后再加上偏移地址,由此得到20位的物理地址(如 1234H:5678H所对应的物理地址为12340H+5678H=179B8H,其中, 1234H:5678H称作逻辑地址或虚地址)。当地址有溢出时(FFFFH:FFFFH 对应的物理地址是FFFF0H+FFFFH=10FFEFH,大于FFFFFH),会发生回卷(10FFEFH = FFF0H)
如此寻址会产生很多问题。一个段大小最大为$2^16=64KB$,并且,所有的段都是可读写的。这意味着不同的段存在着重叠部分(即不同的逻辑地址可以映射到相同的物理地址),无法保证程序的安全性(程序段可被修改),也不具有权限分级
保护模式寻址方式
在定义“逻辑地址”时看到保护模式和实模式的区别在于它是用段选择符而非段基地址,这也许就是保护模式的真谛所在
在保护模式中,处理器将段信息存放于描述符表中。一张描述符表有$2^{13}$个条目(描述符),每条目8字节长,其中包括24位长的段起始物理地址、16位长的段长(因此段的长度范围从1 B到216 B,即不超过64 KiB),其余为属性信息。每一段的地址范围为 段首~段首+段长,每一个段的大小不一定相同(由段长确定)。描述符表有两个,一个是全局描述符表(GDT),一个是局部描述符表(LDT),也就是说,总共可以有$2 * 2^{13}$个段
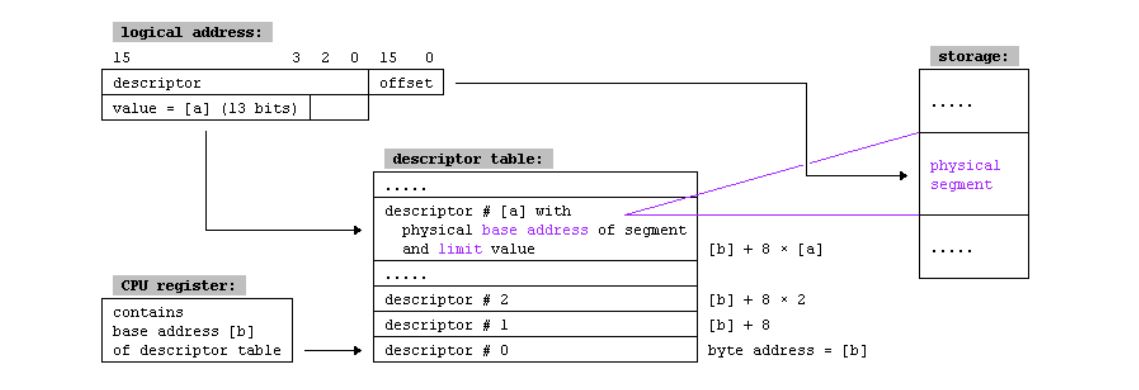
保护模式下,段寄存器保存的内容称作选择器(selector),其本质是索引(13位,即在表中的偏移量)、TI位(1位,表示是使用GDT还是LDT)和优先级信息(2位,0-3值越小优先级越高)
在寻址时,首先拿出选择器(段寄存器)的高13位作为偏移量(索引),结合TI位找到描述符。取出其中24位长的段首地址信息,再加上偏移量(这个偏移量是段地址:偏移量 中的偏移量,前面提到的描述符表的偏移量是段地址的高13位),得到实际物理地址
分页机制
它把物理内存分成相同固定大小$2^{12}=4KB$的页面。在分页寻址模式中,CPU维护一张页目录(page directory)与多张页表(page table),其中,页目首地址由CR3寄存器给出,而页表的首地址存放在页目中。页目与页表中的条目每条均为4字节,而每个页目页表最多能容纳1024个条目(即每张页目页表最大空间占用4KB,4096位)。页目与页表存放信息的方式相似,在每条目的32位中,最高20位(31-12)存放地址信息,剩余12位存放属性信息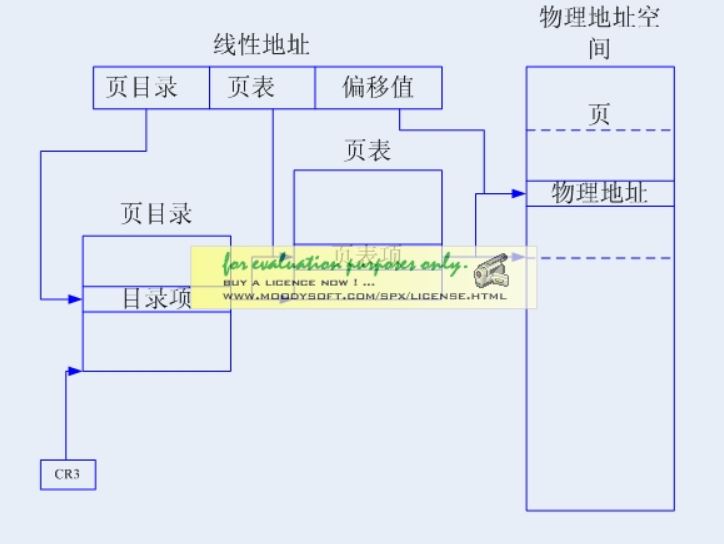
从一个逻辑地址经过分段和分页寻址物理地址的整个过程就如下图所示。总的来说整个过就是逻辑地址经分段机制变成线性地址,如果不启用分页的情况下,此线性地址就是物理地址;如果启用分页,那么线性地址经分页机制变成物理地址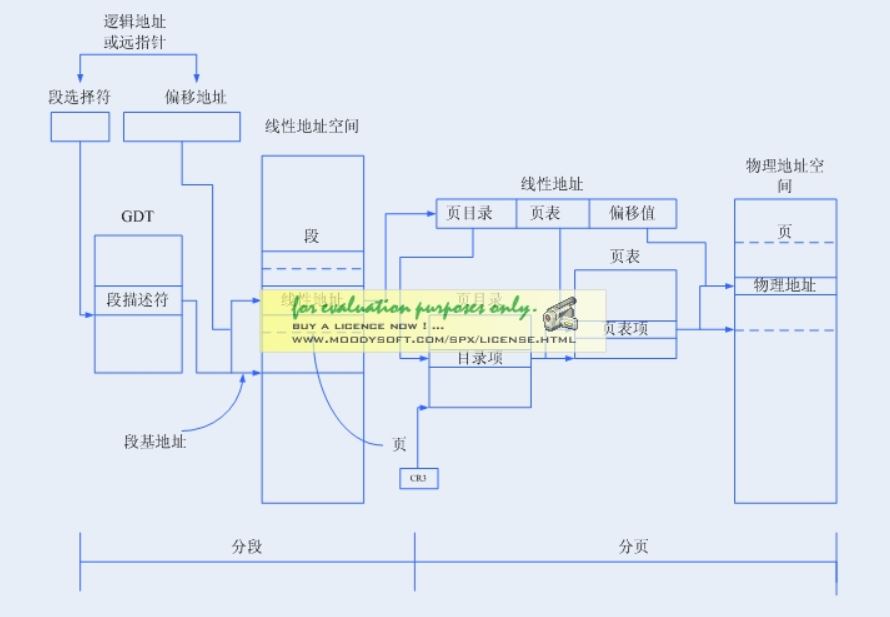
一个多段模型充分发挥了段机制对代码,数据结构和程序提供硬件保护的能力。每个程序都有自己的段描述符表和自己的段。段可以完全属于程序私有也可以和其它程序之间共享
访问权限的检查不仅仅用来保护地址越界,也可以保护某一特定段不允许操作。例如代码段是只读段,硬件可以阻击向代码段进行写操作
做了快一个星期,真的有点难度的哦!!