简介
本实验只需要修改mm.c,mdriver.c是评估所写程序性能的驱动程序
要实现的动态存储分配器将由以下四个函数组成,它们均在mm.h中申明,在mm.c中实现了上述函数的最简单版本,在此基础上修改改进,
int mm_init(void);:应用程序调用该函数去初始化,如分配初始堆区域(heap area)void *mm_malloc(size_t size);:返回一个指向指定大小块的指针,分配的块应位于堆区域内(heap region),且不能和其他块重叠void mm_free(void *ptr);:释放指针所指的区域void *mm_realloc(void *ptr, size_t size);:如果ptr为NULL,相当于mm_malloc;如果size为零,相当于mm_free;ptr不为NULL,则修改指向块的大小,并返回块的位置
动态内存分配器很难正确编程, 因为它们涉及大量的非类型化指针操作。您会发现编写一个堆检查器来扫描堆并检查它的一致性是非常有帮助的。堆检查器可能检查的一些示例如下:
- Is every block in the free list marked as free?
- Are there any contiguous free blocks that somehow escaped coalescing?
- Is every free block actually in the free list?
- Do the pointers in the free list point to valid free blocks?
- Do any allocated blocks overlap?
- Do the pointers in a heap block point to valid heap addresses?
在memlib.c中模拟动态内存分配器的内存系统。可以调用以下函数:
void *memsbrk(int incr): Expands the heap by incr bytes, where incr is a positive non-zero integer and returns a generic pointer to the first byte of the newly allocated heap area. The semantics are identical to the Unix sbrk function, except that memsbrk accepts only a positive non-zero integer argument.void *memheaplo(void): Returns a generic pointer to the first byte in the heap.void *memheaphi(void): Returns a generic pointer to the last byte in the heap.sizet memheapsize(void): Returns the current size of the heap in bytes.sizet mempagesize(void):Returns the system’s page.
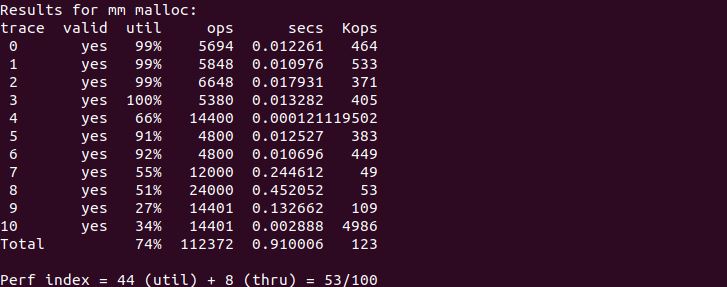
mdriver.c将测试编写程序的正确性、空间利用率和吞吐量。其中有一组trace file,包含了一系列分配、重新分配和释放操作,该驱动程序具有以下参数
-t <tracedir>:Look for the default trace files in directory tracedir instead of the default directory defined in config.h.-f <tracefile>: Use one particular tracefile for testing instead of the default set of tracefiles.-h: Print a summary of the command line arguments.-l: Run and measure libc malloc in addition to the student’s malloc package.-v: Verbose output. Print a performance breakdown for each tracefile in a compact table.-V: More verbose output. Prints additional diagnostic information as each trace file is processed. Useful during debugging for determining which trace file is causing your malloc package to fail.
使用书上的隐式链表+第一次适配连及格分都拿不到